Why 51% of Your Income Still Buys You a Housing Crisis
The mortgage payment on a representative Canadian home now claims 51.1% of median household income. That's the best it's been in ten consecutive quarters, the longest sustained improvement streak in recent memory, and it's still what economists historically called a crisis threshold.
The National Bank of Canada published this figure in mid-2026, and the coverage treated it as good news. Prices have fallen far enough that the math finally moved in the buyer's direction. Ten quarters of improvement. A record run. The headlines wrote themselves.
Nobody mentioned that 51% used to be the number that triggered intervention.
The wrong kind of recovery
Housing affordability in Canada isn't improving because households got wealthier or because mortgage rates collapsed. It's improving because the asset lost value. The representative home is cheaper than it was in 2022, and that price correction, not income growth, not rate cuts, is doing all the work.
That distinction matters. A wage-driven recovery means households have more capacity across the board: more room for savings, more slack for other expenses, more resilience if rates shift again. A price-driven recovery just means the thing you're buying costs less, while everything else you need to survive costs the same or more. Property taxes didn't fall. Home insurance didn't fall. Utility bills didn't fall. The only line item that improved was the purchase price, and it had to drop hard enough to offset three years of rate increases and a qualifying environment that still assumes you can service the debt at 200 basis points above your contract rate.
The long-term average mortgage payment share sat around 40.6% to 40.7% before the market broke. We are now celebrating a ten-quarter streak that has brought us to 51.1%. That gap, roughly ten percentage points, represents the structural distance between "normal" and "still in crisis, just less so than last year."
Markets that haven't moved
The national average hides severe regional splits. The Prairies have seen relatively stable pricing, which sounds like strength until you realize it means affordability there hasn't improved much at all. Vancouver, where the mortgage-to-income ratio sits at 79.4%, and Toronto, at 68.3%, are outliers even within this "improved" national picture. For a first-time buyer in either city, the ten-quarter streak is noise. The threshold is still insurmountable without family money or dual incomes at the high end of the bracket.
Secondary markets in Ontario and British Columbia, the places that overheated hardest during the 2020-2021 run, have corrected the most. Those are the markets pulling the national number down. But transaction volumes remain well below peak levels, which tells you something: even where prices have fallen meaningfully, buyers are still sitting out. That's not a vote of confidence in affordability. That's a market waiting for the other shoe to drop.
What the streak actually means
Ten straight quarters of price-driven improvement is a real milestone, and it may shift psychology for buyers who have been waiting for a bottom. The problem is that "affordability" measured as a percentage of income is only half the equation. The other half is access: can you save the down payment while renting in a tight market? Can you pass the stress test on a single income? Can you stomach the risk of buying into a falling market where your equity could evaporate if prices slide another 10%?
The rental market hasn't loosened. Saving a down payment while renting in tight markets where two-bedroom units can claim a substantial share of median income is harder now than it was before the recent surge in rental rates. The qualifying rate environment has stabilized, but it's stabilized at a level that still screens out a large share of first-time buyers. And the households who bought at the 2022 peak are underwater on paper, watching ten quarters of "gains" erase their net worth.
Price-led recoveries don't build wealth. They redistribute losses. The question isn't whether 51.1% is better than 60%. The question is whether a system where the "good news" is that housing only consumes half your pre-tax income is one we should be defending at all.


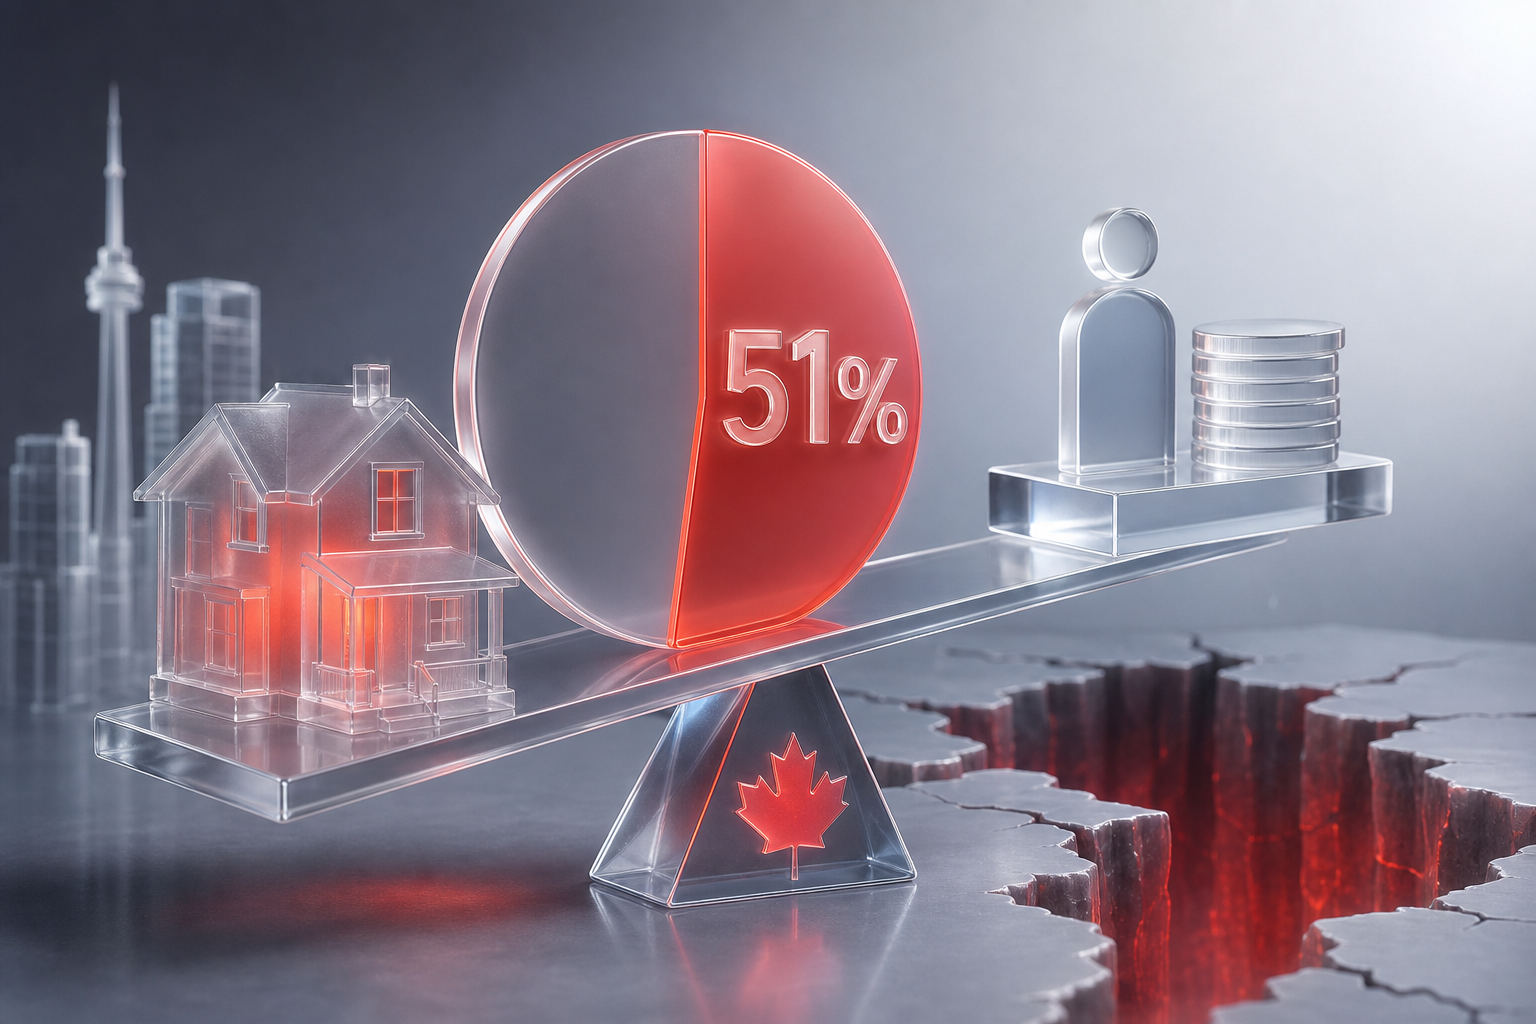

The mortgage payment on a representative Canadian home now claims 51.1% of median household income. That's the best it's been in ten consecutive quarters, the longest sustained improvement streak in recent memory, and it's still what economists historically called a crisis threshold.
The National Bank of Canada published this figure in mid-2026, and the coverage treated it as good news. Prices have fallen far enough that the math finally moved in the buyer's direction. Ten quarters of improvement. A record run. The headlines wrote themselves.
Nobody mentioned that 51% used to be the number that triggered intervention.
The wrong kind of recovery
Housing affordability in Canada isn't improving because households got wealthier or because mortgage rates collapsed. It's improving because the asset lost value. The representative home is cheaper than it was in 2022, and that price correction, not income growth, not rate cuts, is doing all the work.
That distinction matters. A wage-driven recovery means households have more capacity across the board: more room for savings, more slack for other expenses, more resilience if rates shift again. A price-driven recovery just means the thing you're buying costs less, while everything else you need to survive costs the same or more. Property taxes didn't fall. Home insurance didn't fall. Utility bills didn't fall. The only line item that improved was the purchase price, and it had to drop hard enough to offset three years of rate increases and a qualifying environment that still assumes you can service the debt at 200 basis points above your contract rate.
The long-term average mortgage payment share sat around 40.6% to 40.7% before the market broke. We are now celebrating a ten-quarter streak that has brought us to 51.1%. That gap, roughly ten percentage points, represents the structural distance between "normal" and "still in crisis, just less so than last year."
Markets that haven't moved
The national average hides severe regional splits. The Prairies have seen relatively stable pricing, which sounds like strength until you realize it means affordability there hasn't improved much at all. Vancouver, where the mortgage-to-income ratio sits at 79.4%, and Toronto, at 68.3%, are outliers even within this "improved" national picture. For a first-time buyer in either city, the ten-quarter streak is noise. The threshold is still insurmountable without family money or dual incomes at the high end of the bracket.
Secondary markets in Ontario and British Columbia, the places that overheated hardest during the 2020-2021 run, have corrected the most. Those are the markets pulling the national number down. But transaction volumes remain well below peak levels, which tells you something: even where prices have fallen meaningfully, buyers are still sitting out. That's not a vote of confidence in affordability. That's a market waiting for the other shoe to drop.
What the streak actually means
Ten straight quarters of price-driven improvement is a real milestone, and it may shift psychology for buyers who have been waiting for a bottom. The problem is that "affordability" measured as a percentage of income is only half the equation. The other half is access: can you save the down payment while renting in a tight market? Can you pass the stress test on a single income? Can you stomach the risk of buying into a falling market where your equity could evaporate if prices slide another 10%?
The rental market hasn't loosened. Saving a down payment while renting in tight markets where two-bedroom units can claim a substantial share of median income is harder now than it was before the recent surge in rental rates. The qualifying rate environment has stabilized, but it's stabilized at a level that still screens out a large share of first-time buyers. And the households who bought at the 2022 peak are underwater on paper, watching ten quarters of "gains" erase their net worth.
Price-led recoveries don't build wealth. They redistribute losses. The question isn't whether 51.1% is better than 60%. The question is whether a system where the "good news" is that housing only consumes half your pre-tax income is one we should be defending at all.
Sources
Read Next
Canadian Homeowners Are Making Higher Payments. Most Still Don't Know What's Coming.
WestJet's Wheelchair Weight Cap Was Never About Safety
Why a 1,481-Unit Ajax Project Collapsed Before Completion
Ottawa promised tax reform. Experts say three changes matter most.